
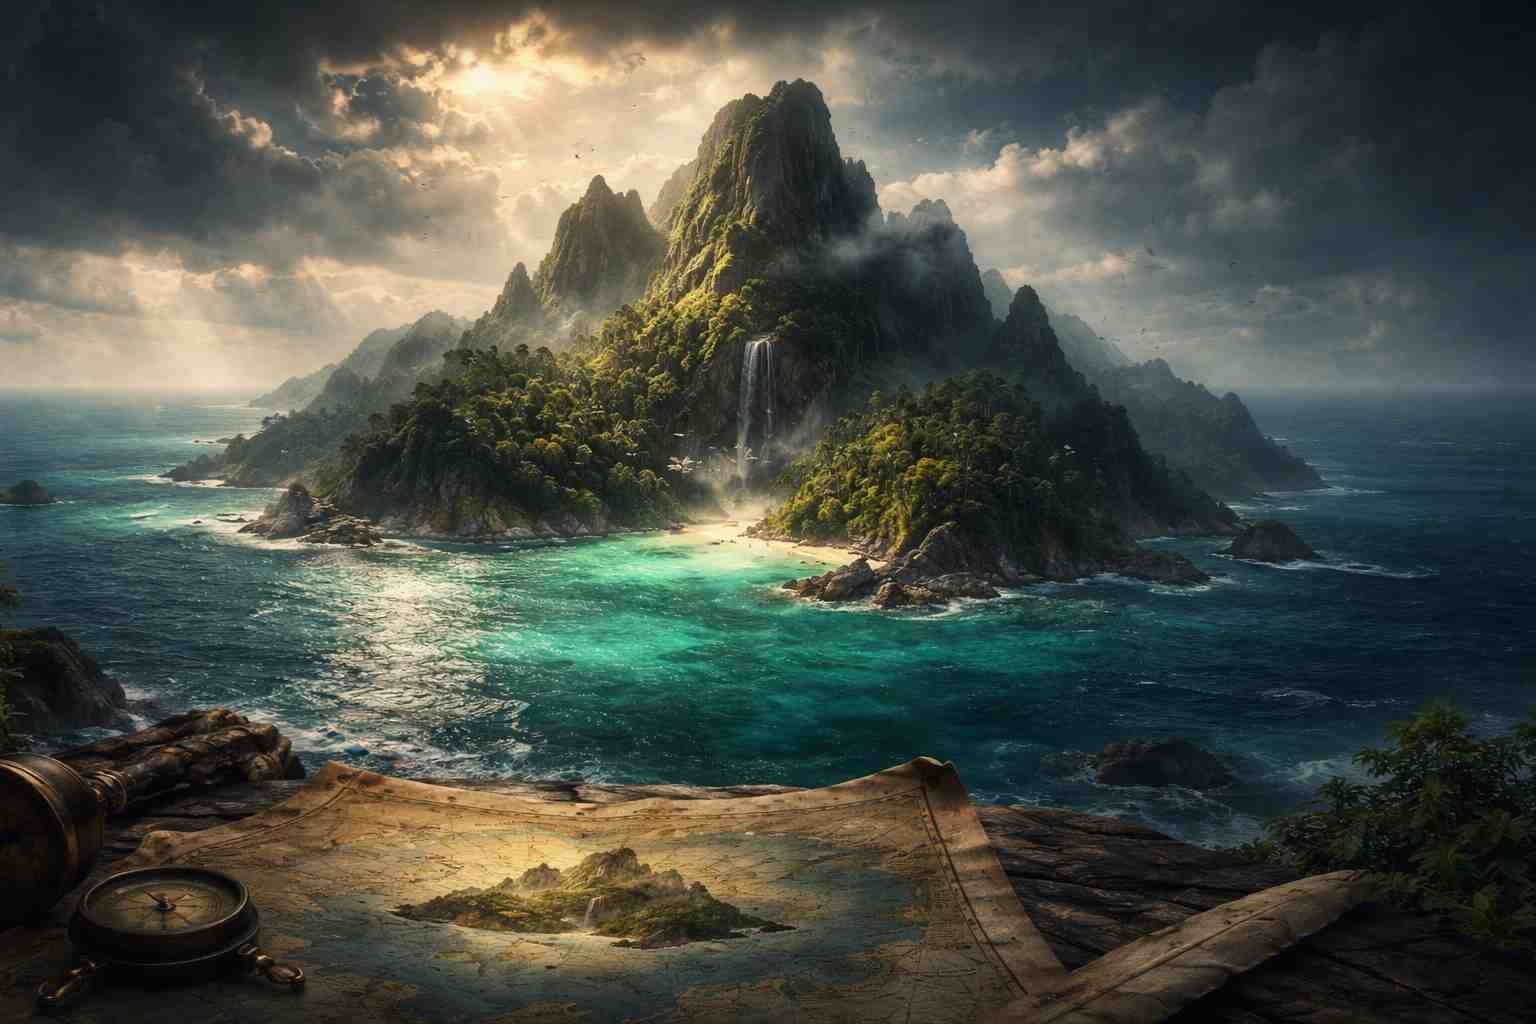
The Island That Appears and Disappears on Maps
For more than a century, maps showed a long, narrow island in the Coral Sea northwest of New Caledonia. Then a research ship reached the plotted location and found open ocean more than a kilometre deep. Sandy Island had not suddenly sunk or drifted away. The evidence indicates that it was a phantom island—an error that travelled from an old sighting into modern digital databases.
Its story is more revealing than a simple cartographic blunder. It shows how uncertain observations can become accepted facts, how databases can inherit one another’s mistakes, and why direct measurement still matters in an age of satellites.
- Reported sighting
- 1876, by the whaling ship Velocity
- Mapped location
- About 500 km northwest of New Caledonia
- Scientific check
- October 2012, aboard R/V Southern Surveyor
- Measured water
- About 1,300 m deep along the ship’s transect
An Island That Did Not Disappear
The popular version of the story says that scientists “undiscovered” an island in 2012. That description is memorable, but it can also be misleading. Sandy Island did not vanish between one survey and the next. The strongest available evidence suggests that the large feature shown on many twentieth- and early twenty-first-century maps was never a permanent island at that location.
The supposed landmass was plotted in the eastern Coral Sea, between the Chesterfield Islands and Nereus Reef. In some digital products it appeared as an elongated shape roughly 25 kilometres long and 5 kilometres wide. Its size made the mistake especially striking: this was not a speck too small for a satellite to resolve, but a feature that should have been unmistakable from ships, aircraft and space.
Myth: Sandy Island physically disappeared beneath the sea shortly before 2012.
Evidence: Hydrographic surveys had already measured deep water in the area, and the lack of nearby active volcanism makes the recent sinking of a large volcanic island implausible.
How the Phantom Island Entered the Record
The clearest historical trail begins with an 1876 report attributed to the whaling ship Velocity. A British Admiralty chart published in 1908 showed an island near 19° south, 160° east and identified the vessel as the source of the sighting. Older maps used the name “Sandy Island” elsewhere, but researchers who reconstructed the error found that those differently placed features were not necessarily the same supposed island.
Early ocean navigation was vulnerable to large positional errors. Longitude was particularly difficult to determine accurately before reliable marine chronometers and standardized surveying practices became widespread. A vessel might also mistake heavy breakers, cloud banks, floating material or distant reefs for land. Once a report entered an official-looking chart, later mapmakers could copy it rather than verify it independently.
Hydrographic charts eventually marked Sandy Island with the abbreviation ED, meaning “existence doubtful.” Repeated failures to find land, combined with depth measurements showing no shallow reef, persuaded the French Hydrographic Service to remove the feature from its official charts in 1974. The Australian Hydrographic Service followed in 1985.
The whaling ship Velocity was credited with reporting the feature that later became the mapped Sandy Island.
A British Admiralty chart recorded an island near the location associated with the Velocity sighting.
French and Australian hydrographic authorities removed the doubtful island from their official nautical charts.
Researchers aboard R/V Southern Surveyor confirmed deep open water near the plotted position and brought the database error to global attention.
What the 2012 Expedition Actually Found
In October 2012, scientists aboard Australia’s R/V Southern Surveyor were studying the tectonic evolution of the eastern Coral Sea during a 25-day voyage. They noticed a conflict: several global scientific datasets and Google Earth displayed Sandy Island, yet the legal hydrographic charts used for navigation did not.
The vessel passed about 5 kilometres south of the supposed island, crossing the nearby bathymetric high shown on the hydrographic chart. Its multibeam sonar measured a minimum depth of approximately 1,300 metres along the transect. That result agreed with earlier hydrographic soundings and was entirely incompatible with a sandy island, a shallow reef or a recently submerged landmass.
An island cannot be hidden just below the waves when the seafloor is roughly 1.3 kilometres down. Erosion, tides and ordinary sea-level changes cannot account for such a difference. The measurement strongly supports the conclusion that the mapped feature was a data error, not a drowned island.
How One Mistake Spread Through Digital Maps
The most valuable part of the Sandy Island story is not the original sighting—it is the way the error survived the transition from paper charts to digital geography.
A coastline resembling the phantom island entered the World Vector Shoreline database, a global digital coastline dataset developed during the conversion of paper charts into computer-readable form. That database was useful and widely adopted, but it contained inherited chart errors and occasional digitizing mistakes in poorly surveyed regions.
Other mapping products then used the same coastline data. Some bathymetric grids treated the Sandy Island polygon as land. Satellite-derived products sometimes applied a “land mask” over the same coordinates, leaving a blank area where ocean observations should have appeared. That blank was not independent satellite proof of an island; it was the old shoreline assumption being reused during data processing.
Google Earth’s unusual black polygon over the site was another symptom of this mismatch. The software’s coastline information said “land,” but no land imagery existed for the location. Rather than revealing a secret island, the dark shape exposed disagreement among underlying datasets.
When several maps repeat the same feature, they may look like separate confirmations. But if they all depend on one original database, they are not independent witnesses. Sandy Island appeared to have many sources when, in practice, the same inherited geometry was echoing through multiple systems.
Could Sailors Have Seen a Pumice Raft?
No surviving evidence can tell us with certainty what the crew of the Velocity observed in 1876. A navigation or transcription error remains a straightforward possibility. Researchers have also proposed a more vivid explanation: a large raft of floating pumice.
Explosive submarine eruptions can produce enormous fields of buoyant volcanic rock. Wind and surface currents can carry these rafts across thousands of kilometres, and their pale, uneven surfaces may resemble low sandy ground from a distance. Studies of pumice moving westward from the Tonga region show that floating material can pass through waters between Fiji and New Caledonia on its way toward Australia.
The hypothesis is plausible, not proven. It explains how experienced sailors might honestly report breakers or apparent islets where no fixed land existed. Yet without a detailed original log, a known eruption tied to the 1876 observation and reliable coordinates, the pumice explanation must remain an informed possibility rather than a settled fact.
Why Satellites Did Not Automatically Fix the Error
It is tempting to assume that satellites continuously photograph every point on Earth and instantly correct every map. Real mapping systems are more complicated. Optical satellites can be obstructed by clouds, haze and the reflective surface of the sea. Deep-ocean bathymetry is often estimated indirectly from satellite measurements of gravity rather than observed by cameras.
Satellites can suggest the broad shape of undersea mountains because large masses subtly affect the sea surface and Earth’s gravity field. They cannot always determine the exact depth of a remote seamount. Direct ship-based sonar remains essential for detailed seafloor mapping, especially where survey tracks are sparse.
Sandy Island therefore illustrates an important scientific principle: advanced technology does not eliminate uncertainty. It changes the kinds of evidence available and the ways errors can propagate. Reliable conclusions still require checking assumptions against direct observations.
What Sandy Island Teaches Us About Maps
Maps are not mirrors of the world. They are models built from observations, measurements, decisions and inherited conventions. Every coastline has a scale, every border reflects a source, and every ocean depth carries some degree of uncertainty.
- Authority is not the same as verification. A feature can appear in respected products because those products share the same source.
- Uncertainty should travel with the data. Labels such as “existence doubtful” are useful only when later systems preserve them.
- Direct measurements remain indispensable. Sonar readings from research vessels can test models that satellites and global grids cannot fully resolve.
- Corrections are a strength of science. Updating a map after better evidence appears is not failure; it is the process working as intended.
The incident also shows why metadata—information about where data came from, how it was collected and how certain it is—matters as much as the visible map. Without that history, a copied error can acquire the appearance of objective truth.
The Continuing Appeal of a Place That Was Never There
Phantom islands occupy a peculiar corner of cultural history because they sit between exploration and imagination. Some arose from honest mistakes; others from unreliable reports, duplicated names or deliberate invention. They remind us that the blank spaces on old maps were not merely empty. They were filled with expectations, rumours and attempts to make sense of incomplete journeys.
Sandy Island is especially compelling because its error survived into the digital age. The story feels modern: one flawed input was copied, transformed and displayed by systems that appeared independent. That pattern is familiar far beyond cartography. It can occur in scientific databases, news reports, business records and online reference material whenever people repeat information without tracing it back to its source.
The island’s real legacy is therefore not a mystery about disappearing land. It is a lesson in intellectual navigation. When evidence conflicts, the best response is neither blind trust nor reflexive suspicion. It is to ask where the information came from, whether the sources are independent, what uncertainty remains and what observation could settle the question.
Keep Exploring the Unexpected
Geography is full of discoveries, corrections and wonderfully strange stories. Test what you know—and uncover a few surprises—through the educational challenges at Bing Quizzes.
Visit Bing QuizzesSources and Further Reading
- Seton, M., Williams, S., Zahirovic, S., & Micklethwaite, S. (2013). “Obituary: Sandy Island (1876–2012).” Eos, Transactions American Geophysical Union, 94(15), 141–142. View the DOI record.
- General Bathymetric Chart of the Oceans (GEBCO). “Disappearance of Sandy Island.” Read GEBCO’s technical explanation.
- ABC Science Archive. “Aussie scientists un-discover Pacific island,” 23 November 2012. Read the archived report.
Educational article • Designed as a self-contained, responsive HTML page